How to benchmark your employee benefits: a practical guide for HR teams
.webp)
Most companies benchmark their benefits once a year, buried inside a renewal conversation. This post argues that's too late. A renewal tells you what your benefits will cost; benchmarking tells you whether that cost is buying competitive value — and those are two very different questions. Using free public data sources like KFF, BLS, SHRM, and IFEBP, HR teams can compare their health plans, contributions, leave policies, and emerging benefits against peer companies by industry, region, and size. The post walks through a five-step process for doing that analysis, introduces Nava HQ as a tool that makes live benchmarking data accessible without waiting for a broker, and closes with a framework for translating findings into three types of action: plan redesign, carrier negotiation, or budget reallocation.
Employee benefits benchmarking is the process of comparing your company's benefits package against data from similar employers, using industry, region, and company size as the reference points. It answers one question your renewal never will: are we getting competitive value for what we're spending?
Most HR teams encounter benchmarking once a year, if at all, as a slide buried in a broker's renewal deck. That's backwards. Benchmarking is most useful before renewal season, not during it. Done right, it's how you walk into a renewal with goals, not just a number to react to.
This guide covers what to benchmark, where the data comes from, and how to turn findings into decisions.
What is employee benefits benchmarking?
Benefits benchmarking is a structured comparison of your benefits program against peer companies, defined by:
- Industry
- Region
- Employer size
The categories covered typically include health plan design, contribution rates, ancillary coverage, leave policies, and emerging benefits like mental health programs or student loan repayment.
The output isn't a grade. It's a map of where your benefits are stronger, weaker, or in line with the market, along with enough context to know which gaps are worth closing.
Why benchmarking matters more than your renewal number
Your renewal number tells you what your benefits will cost next year. It cannot tell you whether that cost is buying competitive value.
That gap matters more than most HR teams realize. Renewals give you a number. Benchmarking gives you the information needed to evaluate it.
Renewal vs. benchmarking: what each one actually tells you
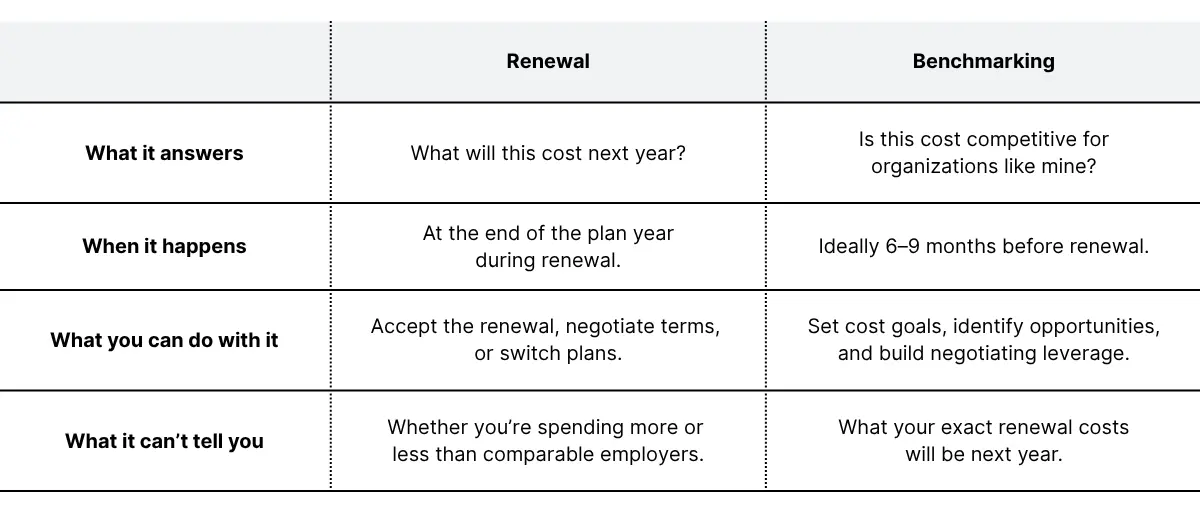
The risk a renewal hides
A renewal might show that your employee contributions stayed flat. A benchmark might show that comparable employers have been increasing their employer contributions, meaning your flat number is actually a relative decrease in generosity. Costs didn't go up. But your package quietly fell behind.
Large employers have always known this. Fortune 500 companies have analysts whose entire job is asking "is this competitive?" Benchmarking is how a 200-person company asks the same question.
What to benchmark
A complete benchmarking analysis covers more than health insurance. Here's what to include and where to find reliable data:
Health plan design and costs
The core of any analysis. Benchmark:
- Premium rates
- Employer and employee contribution splits (by coverage tier)
- Deductibles and out-of-pocket maximums
- Plan type mix (PPO vs. HDHP vs. HMO)
Best sources: KFF Employer Health Benefits Survey (annual, by employer size and industry); BLS National Compensation Survey (regional contribution benchmarks)
Dental and vision
These are table-stakes benefits at most employers. The benchmark question is whether your plan design and contribution match market norms.
Best source: SHRM Employee Benefits Survey (prevalence and plan design benchmarks)
Ancillary and voluntary benefits
Includes life insurance, short- and long-term disability, accident, and critical illness. Benchmark by:
- Prevalence (what percentage of peer employers offer it)
- Employer contribution, where applicable
Best sources: SHRM Employee Benefits Survey; IFEBP annual survey
Leave policies
- PTO accrual rates and caps
- Parental leave duration and pay
- Sick leave policies
Best sources: National Partnership for Women and Families (paid leave benchmarks); SHRM Employee Benefits Survey
Emerging benefits
Mental health coverage and EAP access, student loan repayment, fertility benefits, and financial wellness programs move quickly. Peer data here tells you what's becoming expected, not just what's available.
Best source: IFEBP annual employee benefits survey
Retirement
- 401(k) match structure
- Vesting schedule
- Employer contribution rate
Best sources: BLS data (match prevalence); PSCA annual survey (detailed 401(k) plan design benchmarks)
How to run a benefits benchmarking analysis
Step 1: Define your peer group
Benchmarks are only useful against the right companies. Define peers by:
- Industry (NAICS codes help here)
- Geography (metro area, state, or region)
- Employer size (headcount band)
A 150-person tech company in Austin and a 150-person manufacturer in rural Ohio are not necessarily peers for benefits purposes.
Step 2: Pull your current plan data
Before you can compare, you need a clean picture of what you offer. Gather:
- Plan documents and summaries of benefits coverage (SBCs)
- Current contribution rates, employer and employee, by tier
- Enrollment data by plan
- Leave and ancillary policies in writing
Step 3: Source benchmarking data
- Free, public sources: KFF, BLS, SHRM, and IFEBP cover most categories at no cost. Strong for health plan and leave benchmarks; data updates annually so may lag the market by six to twelve months.
- Commercial survey data: Your broker should have access to Mercer, Mployer, or similar datasets segmented by industry and geography. More granular and more current.
Step 4: Compare and flag gaps
Go line by line. For each benefit category, note whether you're:
- Below median: Potential competitive weakness worth addressing
- At or near median: Confirm whether the spend is intentional
- Above median: A potential differentiator, worth communicating to candidates
Not every gap needs to be closed. A below-median dental plan matters less if your medical is exceptional. The goal is visibility, not uniformity.
Step 5: Bring findings into your pre-renewal strategy
Benchmarking is an input to decisions, not a decision itself. Bring your gap analysis to a pre-renewal strategy meeting, ideally six to nine months before your renewal date. That window gives you time to model changes, test carrier options, and make adjustments before you're under deadline pressure.
Where Nava HQ fits in
Running this analysis manually, pulling public survey data, segmenting by peer group, comparing line by line, takes time most HR teams don't have.
Nava HQ compresses that process. Within HQ, you can access benchmarking data for health plans, contributions, and ancillary benefits filtered by industry, region, and company size, without waiting for a broker to produce a slide once a year.
That's especially valuable when a benchmarking question surfaces outside of renewal season:
- A compensation analysis flags that benefits are lagging
- A key hire pushes back on the package
- Leadership wants to know if the benefits budget is well-allocated
Nava advisors also use HQ data in every pre-renewal strategy conversation, so benchmarking feeds directly into the recommendations your team receives, not as a separate exercise.
.webp)
What to do with your benchmarking results
Findings typically point to one of three actions:
Plan redesign
If your cost-sharing structure is significantly off from peers, particularly deductibles or employee contribution rates, that's a design conversation. Changes affect every employee and need time to model and communicate.
Carrier or vendor negotiation
If your rates are above market for comparable coverage, benchmarking data is your basis for pushing back. "We're paying above the median for our peer group" is a specific, documentable ask.
Budget reallocation
Sometimes the issue isn't total spend, it's where the spend is going. Benchmarking might show you're overinvesting in a category employees don't use while underspending on mental health access they actively want. Reallocation doesn't require a bigger budget.
Frequently asked questions
What data sources are used for employee benefits benchmarking?
The most reliable public sources:
- KFF Employer Health Benefits Survey: Health plan costs and design
- BLS National Compensation Survey: Contributions and leave
- SHRM Employee Benefits Survey: Prevalence across benefit categories
- IFEBP annual surveys: Emerging benefits and voluntary programs
For more granular cuts by industry and geography, commercial surveys from Mercer and similar firms are typically accessed through your broker.
How often should you benchmark your benefits?
At minimum, annually, timed to feed into your pre-renewal strategy. More frequent benchmarking makes sense if you're in a competitive talent market, growing headcount quickly, or evaluating a significant mid-year plan change.
What's the difference between benefits benchmarking and a benefits survey?
- Benefits survey: Employee-facing. Measures satisfaction with your current package.
- Benefits benchmarking: Market-facing. Measures your package against external peer data.
Both are useful. They answer different questions: one tells you whether employees value what you offer; the other tells you whether what you offer is competitive.
How do I know if my benefits are competitive?
Compare your contribution rates, plan design, and benefit prevalence against KFF, BLS, and SHRM data for your peer group. If you're consistently below median on the categories your employees care most about, that's a signal worth acting on. The most important variable isn't a single number: it's whether your package is strong relative to the companies you're actually competing with for talent.


.webp)